
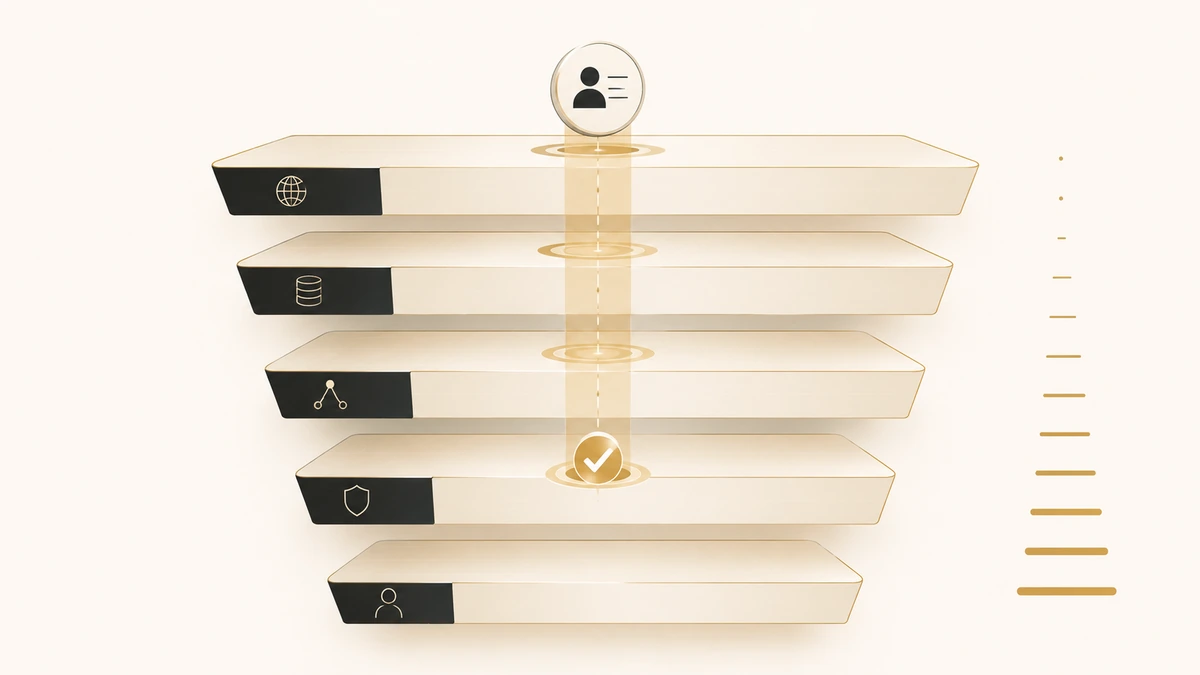
A waterfall always looks like it worked. You point a list of contacts at a chain of data providers, the chain runs, and cells that were empty in the morning are full by lunch. Coverage went up. Nobody argues with coverage.
The trouble starts one level down. Waterfall enrichment doesn’t just find data, it decides how much you paid to find each piece of it, and that decision is made by the order you put the providers in. Move the same five sources around and the same list comes back with roughly the same coverage at a very different price. The fill rate hides that completely.
Every page ranking for this topic is published by a company that sells the cascade, which is why they all explain the mechanism and none of them publish the arithmetic. This page is the arithmetic: how to order providers, what each additional one actually costs per match, and the point where the next source in the chain stops being worth its credits.
Direct answer — what is waterfall enrichment?
Waterfall enrichment is a data method that sends one record through several providers in a fixed order, stopping at the first source that returns a result meeting your confidence threshold. Each provider only sees the records every provider above it failed on. It raises coverage rather than accuracy, and cost per match rises with each position down the chain, so the sequence and the stop condition matter more than the number of providers you connect.
Key Takeaways
- A waterfall raises coverage, not accuracy. Reordering providers changes what you pay for the same result. It does not make any single provider more correct.
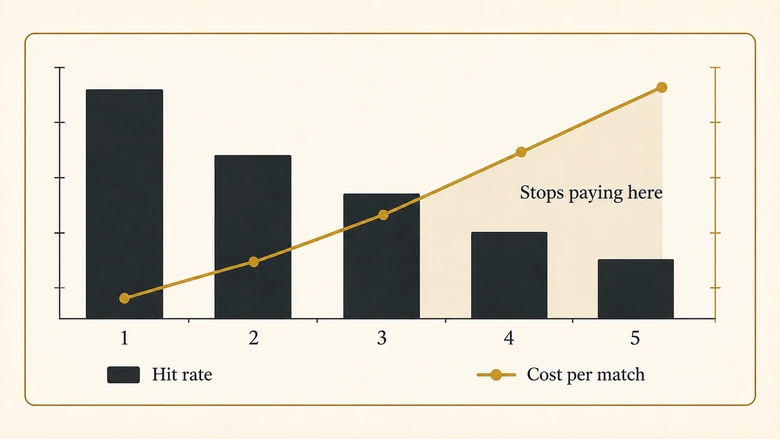
- Every provider down the chain inherits a harder pool. Provider four only ever sees records that providers one, two, and three could not match, so its hit rate is structurally lower and its cost per match structurally higher.
- Cost per match, not match rate, is the number that decides whether the next provider belongs in the chain at all.
- Billing is not consistent across providers, even inside a single waterfall. Apollo’s own documentation says some sources charge only when they return data and others charge for a lookup that finds nothing.
- A returned value is not a verified value. Verification belongs at the end of the cascade, and its cost belongs in your cost-per-match denominator.
- Sequence per field, not per account. The right order for work email is rarely the right order for mobile numbers or firmographics.
What waterfall enrichment actually does
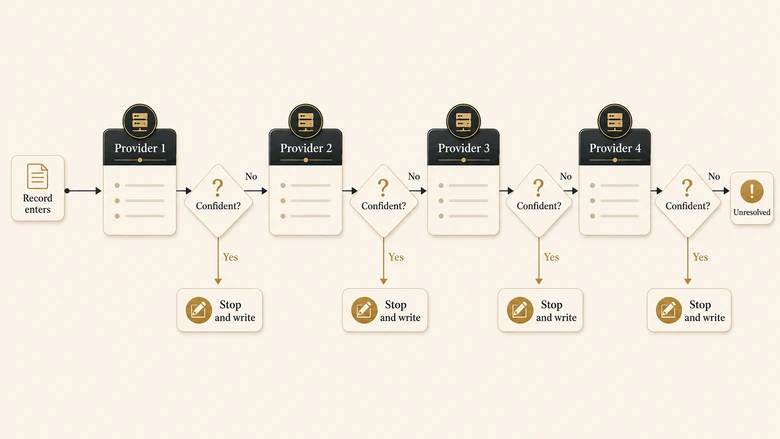
Waterfall enrichment queries data providers one at a time in a defined order until one of them returns a value that clears your confidence threshold. The record enters at the top, hits the first provider, and either exits with a match or falls through to the second. That loop repeats until a provider answers or the chain runs out.
Two properties follow from that structure, and both get missed. The first is that the chain is a coverage instrument. It widens the set of records you can fill, because different vendors built their databases from different sources and their gaps don’t line up. It does nothing for the correctness of any individual answer. If your first provider returns a confident but wrong mobile number, the waterfall stops there and hands you the wrong number, having worked exactly as designed.
The second is that each provider sits in a different position in a queue that is getting harder. Provider one sees your whole list. Provider two sees only the records provider one couldn’t match, which are, by definition, the more obscure ones. By provider four you’re working the residue: contacts at small companies, in under-covered regions, with unusual name formats. Hit rates fall down the chain because the pool is adversely selected, not because the vendor is worse.
This page covers the sequencing and the economics. If you need the surrounding method first, the parent guide to B2B data enrichment covers where enrichment data comes from and how it fits the rest of the workflow, and the field definitions behind firmographic and technographic data settle what you’re actually asking providers to return.
Waterfall vs single-source vs parallel enrichment
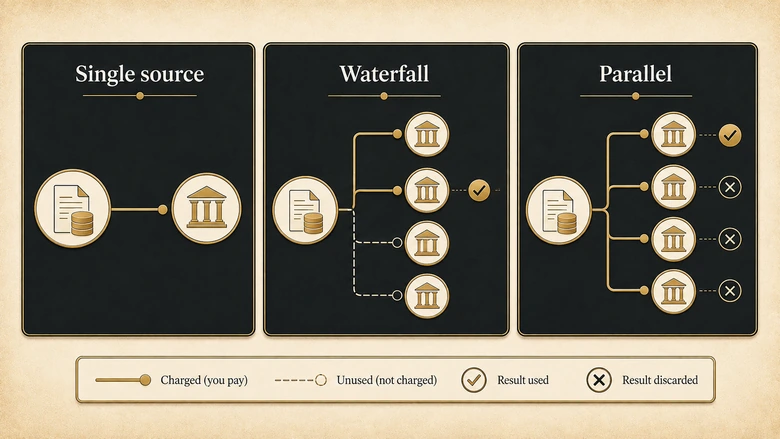
There are three ways to buy the same data point, and they differ in how many providers see the record and what you’re billed for. Sequential waterfalls are the middle option, not the default one.
| Approach | How it queries | What you pay for | Use when | Where it hurts |
|---|---|---|---|---|
| Single source | One provider, one lookup per record | One lookup, predictable | One vendor’s coverage already clears your bar in your regions | Your ceiling is that vendor’s database, and a miss is final |
| Waterfall (sequential) | Providers in a fixed order, stops at the first confident result | Varies by provider: some charge only on a return, some on every lookup | Coverage matters more than billing simplicity and you can measure per-provider cost | Cost per match climbs with chain depth and the invoice is hard to predict |
| Parallel (query all, then pick) | Every provider at once, then a rule selects the winner | Every provider, on every record | You need conflict visibility or a confidence vote across sources | The most expensive per record, because you pay for answers you throw away |
Parallel querying is what you want when disagreement between sources is the thing you’re trying to see, which is a data-quality exercise rather than a coverage one. Sequential is what you want when you’d rather stop paying as soon as somebody answers. Most teams describing a “waterfall” are running the sequential form.
How to sequence providers
Provider order is set by three inputs, applied in this priority: price per lookup, accuracy at your confidence threshold, then coverage. Clay’s own guide puts them in that order, and the logic holds regardless of platform. You want the cheapest source that can answer confidently to answer first, and the source with the widest reach to sit last as the catch-all.
The reason this isn’t obvious is that accuracy and coverage are separate axes, and vendors are rarely strong on both. Clay’s published work-email benchmark puts Hunter at roughly 95% accuracy but only about 50% coverage, against Findymail at about 93% accuracy and roughly 90% coverage. Those are the vendor’s own figures and they’re self-reported, but the shape is the useful part: a precise, narrow source and a broad, slightly looser one are doing different jobs. The precise one goes early, where a confident answer ends the lookup cheaply. The broad one goes last, where its job is to rescue whatever’s left.
Sequence per field, not per list
A single global order is the most common configuration mistake. The vendor that leads your work-email chain is frequently mediocre at mobile numbers, and neither ranking has much to do with which source knows a company’s headcount or tech stack. Each field deserves its own chain, because the underlying databases were built from different raw material.
Region belongs in the same decision. A provider with strong North American coverage can fall off sharply in EMEA or APAC, which means the correct order for a US list and a DACH list are different orders, not the same order with worse results. Licensing sits alongside it: some sources restrict what you may store or re-sell, and a source you can’t legally write into your CRM shouldn’t be in the chain no matter how well it performs.
PRO TIP
Build one chain per field per region, then leave it alone for a full month before you tune it. Reordering weekly gives you a series of tiny, noisy samples and no baseline to compare against.
Which vendors belong in the chain is a separate purchase decision from how you order them, and it should be settled first. Shortlist on what a provider will disclose about how its coverage figure was produced, not on the figure itself. A vendor that publishes its denominator is telling you something you can check. One that publishes only a percentage is telling you nothing you can test.
Coverage versus cost per match
Cost per match is the total spend on a field divided by the number of verified values you got back. It’s the only figure that lets you compare a chain of five providers against a chain of two, and almost nobody calculates it, because the platforms report credits consumed and fill rate as separate numbers and never divide one by the other.
Cost per match = Total credits spent ÷ Verified matches returnedBoth halves of that fraction are usually wrong on first attempt. The numerator has to include credits burned on lookups that found nothing, because those are real charges attached to real records. The denominator has to exclude values that failed verification later, because a bounced address was never a match. Get either wrong and the number flatters the chain.
The figure that actually governs chain design, though, is marginal: what the last provider costs for the records only it could fill.
Marginal cost per match = Credits spent by provider N ÷ Matches only provider N returnedRun that on position four or five of a mature chain and the result is usually uncomfortable. Suppose your first three providers clear 70% of a 1,000-record list. Provider four now works 300 adversely selected records and returns 45 of them, a 15% hit rate on its slice. It charged for all 300 lookups. At BetterContact’s entry rate of $15 for 200 credits, or about $0.075 per verified email (as of Q3 2026), those 300 lookups cost roughly $22.50 and produced 45 usable addresses, which is about $0.50 each. The same provider sitting in position one would have looked far cheaper per match and told you nothing about whether it earns its place at the bottom.
That’s the whole argument for measuring position rather than provider. A source is not expensive or cheap in the abstract. It’s expensive or cheap at a given depth, against a given residue, and moving it changes the answer. The same discipline applies further up the funnel, where cost-per-lead figures collapse the moment you ask what the denominator counted.
The three billing models you’ll actually meet
Cost per match is only computable if you know when a credit is charged, and that varies by provider inside a single cascade. This is the part the category documentation is least clear about, and the differences are large enough to change which chain is cheapest.
Apollo’s developer documentation is the most direct about it, stating that some data sources charge only when they return data while others may consume credits for a lookup even when they don’t find an email address or phone number. BetterContact takes the opposite position and charges a credit only after successful verification of the data, with no charge for catch-alls (as of Q3 2026). Clay’s marketing guide says you’re billed only for the lookup that returns the answer, though its own support community describes configurations where a failed attempt and the successful one that follows are both charged, plus validation.
IMPORTANT
Don’t model your costs from a pricing page. Run 500 records, then reconcile the credit log against the invoice. Where a vendor’s marketing and its own support docs disagree, the invoice is the one that’s binding.
How to measure a waterfall honestly
Four words get used interchangeably in this category and mean four different things. Coverage is the share of your list a source could theoretically fill. Hit rate is the share it actually answered on the slice it saw. Fill rate is the share of cells that ended up non-empty. Match rate is whichever of those a vendor found most flattering, which is why two providers quoting 90% may be describing completely different achievements.
The denominator is where the ambiguity lives. A provider in position four reporting a 15% hit rate on 300 residual records and a provider in position one reporting 70% on 1,000 are not comparable, and averaging them produces a number that means nothing. Any figure you keep needs its denominator written next to it or it isn’t a measurement.
Then there’s the verification gap. Providers report what they returned, not what survived contact with a mail server. Until an address has been verified, treat it as a candidate. The one genuinely enforced number in email is Google’s bulk-sender requirement to keep reported spam rates below 0.3%, and unverified enrichment output is one of the faster ways to breach it. What counts as an acceptable validity floor before that becomes a problem is covered in our audit of CRM data quality benchmarks, which grades the circulating figures on whether anyone actually measured them.
For the vendor-facing version of this exercise, where you’re testing candidate providers against a controlled sample before buying, the coverage-test protocol in our enrichment tooling review is the one to run. The workflow below is the operational counterpart: it prices a chain you already own.
Workflow · 30 min
How to work out your true cost per match
A desk exercise that prices each provider at the position it actually occupies, using one month of logs you already have.
Export one month of enrichment logs
Pull every record the chain touched, with the provider that answered, the credits charged, and whether the value later passed verification. Filter to a single field so the maths stays clean.
Count verified matches per provider
Count only values that passed verification. Exclude catch-alls and anything that bounced. A returned value that failed is not a match and must not sit in the denominator.
Total the credits each provider consumed
Include lookups that returned nothing. Those credits are real and they belong to the provider that spent them. If your platform reports credits only in aggregate, run 500 records and reconcile against the invoice.
Divide to get cost per match at position
For each provider, divide its credits spent by the verified matches only it returned, then convert credits to currency at your plan rate. Record the position number beside each result.
Test the last provider against your alternative
Set the bottom provider’s cost per match beside what the same records would cost through manual research, or against the cost of leaving the field empty. Remove it from the chain if it loses that comparison.
Where waterfalls break
Most waterfall failures are silent. The chain still runs, the cells still fill, and the damage shows up somewhere downstream as a bounce, a duplicate, or a rep calling a number that belongs to somebody who left two years ago.
Overwriting a better value with a worse one. If your stop condition is “field is empty” rather than “field is empty or stale,” a later run can let a lower-confidence source replace a value a stronger source supplied earlier. Waterfalls need survivorship rules for the same reason merges do, and the field-level logic in our guide to lead deduplication is the same logic that should govern which provider is allowed to win a conflict.
Stale values blocking the chain. The mirror-image failure: a field that’s populated but wrong stops the waterfall from ever running, because the record never looks like it needs enrichment. That’s an argument for re-verification intervals rather than one-time fills, and the reconciliation of published CRM data decay statistics is where to set yours.
Verification in the wrong place. Verifying inside each provider step means paying to validate answers you’re about to discard. Verifying once, after the chain resolves, is cheaper and gives you one consistent standard instead of several. Where the verification itself happens is a tooling decision, and our review of email deliverability tools covers the options for that final gate.
Chains that grow and never shrink. Providers get added when coverage disappoints and are almost never removed, because removal requires the marginal number nobody calculated. A chain of eight sources where positions six through eight each return under 2% is common, and it’s pure drag on both cost and run time.
When a waterfall is not worth building
The cascade earns its complexity in a narrow band of situations, and outside that band a single good provider plus a verification step beats it on every axis that matters.
Build one when your list spans regions no single vendor covers well, when the field you need is genuinely sparse in the market, when volume is high enough that a few cents per record compounds into real money, and when somebody owns the measurement. Skip it when one provider already clears your coverage bar, when your monthly volume is in the hundreds rather than the tens of thousands, when nobody will run the marginal-cost check, or when the field you’re chasing has poor coverage everywhere and you’re really buying the same gaps four times over.
That last case is the one worth naming plainly. If four vendors all source from broadly the same public web, chaining them adds cost without adding much independent signal, and the honest answer is that the data doesn’t exist rather than that you need a fifth source.
The measurement burden is also a staffing question. A waterfall is a system that needs an owner who reads credit logs and prunes the chain, and that ownership usually sits with whoever does the GTM engineering work in your organisation. Without that person, a cascade reliably becomes an expensive default nobody revisits.
Frequently Asked Questions
On Apollo, waterfall enrichment checks your connected third-party data sources in an order you define whenever Apollo’s own database lacks the email or phone number. Credit consumption depends on which source returns the data, and Apollo’s documentation notes that some connected sources charge for a lookup even when they find nothing.
Waterfall enrichment runs by default across a team based on the email and phone settings an admin configures. To disable it, remove every third-party data source from the waterfall lineup so lookups use Apollo data only. Credit usage stays the same, but coverage will typically be lower.
No. They share a name and nothing else. The waterfall model is a sequential software development methodology with phases like requirements and design. Waterfall enrichment is a B2B data method that queries providers in priority order until one returns a usable contact or company field.
There’s no correct count. Add a provider only while its marginal cost per match beats your alternative, which is usually manual research or an empty field. In practice most chains stop earning somewhere between three and five sources, because positions beyond that work an adversely selected residue.
In a sequential waterfall the question rarely arises, because the chain stops at the first confident answer. When it does, resolve it with an explicit survivorship rule: highest confidence score first, then most recently verified, then source priority. Never let recency of the run decide it by accident.
Methodology and sources
Provider ordering logic and the accuracy-versus-coverage figures for Hunter and Findymail are Clay’s own published work-email benchmark, cited as vendor self-reported data rather than independent testing. Credit-consumption behaviour is taken from each vendor’s primary documentation: Apollo’s developer docs for the statement that behaviour differs between connected sources, BetterContact’s pricing page for the verified-only charging model, and Clay’s support community for the contested case. The 0.3% figure is Google’s published bulk-sender requirement.
IVRIS has not independently tested any provider’s coverage or accuracy, and no figure on this page is an IVRIS measurement. The worked example uses BetterContact’s published entry-tier rate to illustrate the arithmetic; substitute your own plan rate before drawing conclusions.
Last reviewed: 12 August 2026.
Revision history: 12 August 2026, first publication.
Suggested citation: IVRIS Tech, “Waterfall Enrichment: Sequence Providers, Price Each Match,” https://ivristech.com/waterfall-enrichment/, reviewed 12 August 2026.





